深入理解 Linux 内存机制!| 技术头条
作者 | 阿文责编 | 郭芮作为一名Linux 系统运维工程,在日常管理 Linux 的时候,我们经常发现系统的空闲内存差不多总是被用完了。通常,我们可以通过 top 和 free 查看内存使用情况:top-15:03:28up7days,1:34,1user,loadaverage:0.00,0.00,0.00Tas...


作者 | 阿文
责编 | 郭芮
作为一名Linux 系统运维工程,在日常管理 Linux 的时候,我们经常发现系统的空闲内存差不多总是被用完了。
通常,我们可以通过 top 和 free 查看内存使用情况:
top - 15:03:28 up 7 days,  1:34,  1 user,  load average: 0.00, 0.00, 0.00Tasks:  84 total,   2 running,  51 sleeping,   0 stopped,   0 zombie%Cpu(s):  0.0 us,  0.3 sy,  0.0 ni, 99.7 id,  0.0 wa,  0.0 hi,  0.0 si,  0.0 stKiB Mem :  1006556 total,    65612 free,   174148 used,   766796 buff/cacheKiB Swap:   969964 total,   969964 free,        0 used.   660016 avail Mem  PID USER      PR  NI    VIRT    RES    SHR S %CPU %MEM     TIME+ COMMAND  649 root      10 -10  140280  13976   8536 S  0.3  1.4  34:45.14 AliYunDun 7945 root      20   0   43532   3772   3172 R  0.3  0.4   0:00.01 top    1 root      20   0  159728   8988   6676 S  0.0  0.9   0:06.86 systemd    2 root      20   0       0      0      0 S  0.0  0.0   0:00.04 kthreadd    3 root       0 -20       0      0      0 I  0.0  0.0   0:00.00 rcu_gp    4 root       0 -20       0      0      0 I  0.0  0.0   0:00.00 rcu_par_gp    ……0.00, 0.00, 0.00
Tasks:  84 total,   2 running,  51 sleeping,   0 stopped,   0 zombie
%Cpu(s):  0.0 us,  0.3 sy,  0.0 ni, 99.7 id,  0.0 wa,  0.0 hi,  0.0 si,  0.0 st
KiB Mem :  1006556 total,    65612 free,   174148 used,   766796 buff/cache
KiB Swap:   969964 total,   969964 free,        0 used.   660016 avail Mem

  PID USER      PR  NI    VIRT    RES    SHR S %CPU %MEM     TIME+ COMMAND
  649 root      10 -10  140280  13976   8536 S  0.3  1.4  34:45.14 AliYunDun
 7945 root      20   0   43532   3772   3172 R  0.3  0.4   0:00.01 top
    1 root      20   0  159728   8988   6676 S  0.0  0.9   0:06.86 systemd
    2 root      20   0       0      0      0 S  0.0  0.0   0:00.04 kthreadd
    3 root       0 -20       0      0      0 I  0.0  0.0   0:00.00 rcu_gp
    4 root       0 -20       0      0      0 I  0.0  0.0   0:00.00 rcu_par_gp
    ……
执行 free:
# free              total        used        free      shared  buff/cache   availableMem:        1006556      174140       65588        6936      766828      660024Swap:        969964           0      969964root@aliyun:~# free              total        used        free      shared  buff/cache   availableMem:        1006556      174140       65588        6936      766828      660024Swap:        969964           0      969964
              total        used        free      shared  buff/cache   available
Mem:        1006556      174140       65588        6936      766828      660024
Swap:        969964           0      969964root@aliyun:~# free
              total        used        free      shared  buff/cache   available
Mem:        1006556      174140       65588        6936      766828      660024
Swap:        969964           0      969964
为了更人性化地显示,我们可以加上 -h 选项:
# free -h              total        used        free      shared  buff/cache   availableMem:           982M        170M         63M        6.8M        748M        644MSwap:          947M          0B        947M
              total        used        free      shared  buff/cache   available
Mem:           982M        170M         63M        6.8M        748M        644M
Swap:          947M          0B        947M
可以看到我们的可用内存才 63M,总共内存1G,但是,事实真的是内存被用完了吗?要了解这个问题,我们需要了解 Linux 的内存分配管理机制。
在 Linux 中为了充分发挥和利益可用的内存空间,Linux 会把一些程序调用过的硬盘数据写入内存,利用内存的读写高速的特性提高 Linux 系统的数据访问性能。
那么我们看下 Windows,Windows 操作系统的内存是只有当使用的时候,才会分配内存,这就导致你有4个G内存,但是实际只用了2个G,而剩下的2个G就一直处于空闲状态,而 Linux 则将所有的内存都利用起来。
Linux 的这个特性,主要是把物理内存划分出一部分的空间,我们称作 cache/buffers。
    $ free -h                  total        used        free      shared  buff/cache   available    Mem:           1.9G         63M        1.3G        8.5M        531M        1.7G    Swap:          2.0G          0B        2.0G
                  total        used        free      shared  buff/cache   available
    Mem:           1.9G         63M        1.3G        8.5M        531M        1.7G
    Swap:          2.0G          0B        2.0G
你可以看到,free 输出的是一个表格,其中的数值都默认以字节为单位。表格总共有两行六列,这两行分别是物理内存 Mem 和交换分区 Swap 的使用情况,而六列中,每列数据的含义分别为:
-
第一列,total是总内存大小;
-
第二列,used是已使用内存的大小,包含了共享内存;
-
第三列,free是未使用内存的大小;
-
第四列,shared是共享内存的大小;
-
第五列,buff/cache是缓存和缓冲区的大小;
-
最后一列,available是新进程可用内存的大小。
注意一下,最后一列的可用内存available。available 不仅包含未使用内存,还包括了可回收的缓存,所以一般会比未使用内存更大。不过,并不是所有缓存都可以回收,因为有些缓存可能正在使用中。
这里的 buffer 和cache 是什么意思呢?我们可以通过 man free 查看解释。
DESCRIPTION       free displays the total amount of free and used physical and swap memory in the system, as well as the buffers and caches used by the kernel. The information is gathered by parsing /proc/meminfo. The displayed columns are:       total  Total installed memory (MemTotal and SwapTotal in /proc/meminfo)       used   Used memory (calculated as total - free - buffers - cache)       free   Unused memory (MemFree and SwapFree in /proc/meminfo)       shared Memory used (mostly) by tmpfs (Shmem in /proc/meminfo)       buffers              Memory used by kernel buffers (Buffers in /proc/meminfo)       cache  Memory used by the page cache and slabs (Cached and SReclaimable in /proc/meminfo)       buff/cache              Sum of buffers and cache       available              Estimation  of  how  much  memory  is  available  for  starting  new  applications, without swapping. Unlike the data provided by the cache or free fields, this field takes into account page cache and also that not all              reclaimable memory slabs will be reclaimed due to items being in use (MemAvailable in /proc/meminfo, available on kernels 3.14, emulated on kernels 2.6.27+, otherwise the same as free)

       total  Total installed memory (MemTotal and SwapTotal in /proc/meminfo)

       used   Used memory (calculated as total - free - buffers - cache)

       free   Unused memory (MemFree and SwapFree in /proc/meminfo)

       shared Memory used (mostly) by tmpfs (Shmem in /proc/meminfo)

       buffers
              Memory used by kernel buffers (Buffers in /proc/meminfo)

       cache  Memory used by the page cache and slabs (Cached and SReclaimable in /proc/meminfo)

       buff/cache
              Sum of buffers and cache

       available
              Estimation  of  how  much  memory  is  available  for  starting  new  applications, without swapping. Unlike the data provided by the cache or free fields, this field takes into account page cache and also that not all
              reclaimable memory slabs will be reclaimed due to items being in use (MemAvailable in /proc/meminfo, available on kernels 3.14, emulated on kernels 2.6.27+, otherwise the same as free)
可以看到 buff 和 cache 的数据来源都是来自 /proc/meminfo。
-
Buffers 是内核缓冲区用到的内存,对应的是 /proc/meminfo 中的 Buffers 值;
-
Cache 是内核页缓存和 Slab 用到的内存,对应的是 /proc/meminfo 中的 Cached 与 SReclaimable 之和。
~# cat /proc/meminfo | grep SRSReclaimable:      67024 kBroot@linux:~# cat /proc/meminfo | grep CacCached:           491004 kB
SReclaimable:      67024 kB
root@linux:~# cat /proc/meminfo | grep Cac
Cached:           491004 kB
这些数值都来自 /proc/meminfo,但更具体的 Buffers、Cached 和 SReclaimable 的含义是什么呢?

proc 文件系统
我们都知道 procfs 是进程文件系统(file system)的缩写,它包含一个伪文件系统(启动时动态生成的文件系统),用于通过内核访问进程信息。这个文件系统通常被挂载到 /proc 目录。由于 /proc 不是一个真正的文件系统,它也就不占用存储空间,只是占用有限的内存。我们可以通过对/proc 文件系统的读写操作为与kernel实体间进行通信的一种手段。也就是说可以通过修改/proc中的文件,来对当前kernel的行为做出调整。
我们执行 man proc 定位到 meninfo:
  Buffers %lu                     Relatively temporary storage for raw disk blocks that shouldn't get tremendously large (20MB or so).              Cached %lu                     In-memory cache for files read from the disk (the page cache).  Doesn't include SwapCached.   SReclaimable %lu (since Linux 2.6.19)                     Part of Slab, that might be reclaimed, such as caches.SUnreclaim %lu (since Linux 2.6.19)                     Part of Slab, that cannot be reclaimed on memory pressure.for raw disk blocks that shouldn't get tremendously large (20MB or so).

              Cached %lu
                     In-memory cache for files read from the disk (the page cache).  Doesn't include SwapCached.
   SReclaimable %lu (since Linux 2.6.19)
                     Part of Slab, that might be reclaimed, such as caches.

SUnreclaim %lu (since Linux 2.6.19)
                     Part of Slab, that cannot be reclaimed on memory pressure.
通过man手册,我们可以看到:
-
Buffers 是对原始磁盘块的临时存储,也就是用来缓存磁盘的数据,通常不会特别大(20MB左右)。这样,内核就可以把分散的写集中起来,统一优化磁盘的写入,比如可以把多次小的写合并成单次大的写等等。
-
Cached 是从磁盘读取文件的页缓存,也就是用来缓存从文件读取的数据。这样,下次访问这些文件数据时,就可以直接从内存中快速获取,而不需要再次访问缓慢的磁盘。
-
SReclaimable 是 Slab 的一部分。Slab 包括两部分,其中的可回收部分用 SReclaimable 记录;而不可回收部分用 SUnreclaim 记录。
我们可以通过调整/proc/sys/vm/drop_caches来释放内存:
# free -h # 未释放之前              total        used        free      shared  buff/cache   availableMem:           982M        170M         63M        6.8M        748M        644MSwap:          947M          0B        947M# cat /proc/sys/vm/drop_caches  # 默认值是 0 0# echo 3 > /proc/sys/vm/drop_caches# cat /proc/sys/vm/drop_caches # 释放之后3# free -h  # 查看释放之后的内存,可以看到可用内存变成了 738 M              total        used        free      shared  buff/cache   availableMem:           982M        167M        738M        6.6M         77M        704MSwap:          947M          0B        947M free -h # 未释放之前
              total        used        free      shared  buff/cache   available
Mem:           982M        170M         63M        6.8M        748M        644M
Swap:          947M          0B        947M
# cat /proc/sys/vm/drop_caches  # 默认值是 0
0
# echo 3 > /proc/sys/vm/drop_caches
# cat /proc/sys/vm/drop_caches # 释放之后
3
# free -h  # 查看释放之后的内存,可以看到可用内存变成了 738 M
              total        used        free      shared  buff/cache   available
Mem:           982M        167M        738M        6.6M         77M        704M
Swap:          947M          0B        947M
关于 /proc/sys/vm/drop_caches 的用法在下面进行了说明,我们可以通过 man proc 然后定位到 drop_caches 查看说明:
/proc/sys/vm/drop_caches (since Linux 2.6.16)              Writing to this file causes the kernel to drop clean caches, dentries, and inodes from memory, causing that memory to become free.  This can be useful for memory management testing and performing reproducible  filesys‐              tem benchmarks.  Because writing to this file causes the benefits of caching to be lost, it can degrade overall system performance.              To free pagecache, use:                  echo 1 > /proc/sys/vm/drop_caches              To free dentries and inodes, use:                  echo 2 > /proc/sys/vm/drop_caches              To free pagecache, dentries and inodes, use:                  echo 3 > /proc/sys/vm/drop_caches              Because writing to this file is a nondestructive operation and dirty objects are not freeable, the user should run sync(1) first.drop clean caches, dentries, and inodes from memory, causing that memory to become free.  This can be useful for memory management testing and performing reproducible  filesys‐
              tem benchmarks.  Because writing to this file causes the benefits of caching to be lost, it can degrade overall system performance.

              To free pagecache, use:

                  echo 1 > /proc/sys/vm/drop_caches

              To free dentries and inodes, use:

                  echo 2 > /proc/sys/vm/drop_caches

              To free pagecache, dentries and inodes, use:

                  echo 3 > /proc/sys/vm/drop_caches

              Because writing to this file is a nondestructive operation and dirty objects are not freeable, the user should run sync(1) first.
同时,我们查看vmstat 的 buff 和 cache:
root@linux:~# vmstat 1procs -----------memory---------- ---swap-- -----io---- -system-- ------cpu----- r  b   swpd   free   buff  cache   si   so    bi    bo   in   cs us sy id wa st 0  0      0 7790168   3492 188780    0    0   314     9  120   94  0  0 99  0  0 0  0      0 7790160   3492 188816    0    0     0     0   76  172  0  0 100  0  0 0  0      0 7790160   3492 188816    0    0     0     0   88  222  0  1 100  0  0 0  0      0 7790160   3492 188816    0    0     0     0   83  199  0  0 100  0  0 0  0      0 7790192   3500 188816    0    0     0    24   87  215  0  0 100  1  0 0  0      0 7790192   3500 188816    0    0     0     0   76  174  0  0 100  0  0 0  0      0 7790192   3500 188816    0    0     0     0   77  205  0  0 100  0  0 0  0      0 7790192   3500 188816    0    0     0     0  125  292  0  0 100  0  0 0  0      0 7790192   3500 188816    0    0     0   344  215  198  0  0 97  3  0 0  0      0 7790192   3500 188816    0    0     0     0   64  182  0  0 100  0  0 1  0      0 7790192   3500 188816    0    0     0     0   82  201  0  1 100  0  0 0  0      0 7790192   3500 188816    0    0     0     0   65  153  0  0 100  0  0 0  0      0 7790192   3500 188816    0    0     0     0   58  144  0  0 100  0  0
procs -----------memory---------- ---swap-- -----io---- -system-- ------cpu-----
 r  b   swpd   free   buff  cache   si   so    bi    bo   in   cs us sy id wa st
 0  0      0 7790168   3492 188780    0    0   314     9  120   94  0  0 99  0  0
 0  0      0 7790160   3492 188816    0    0     0     0   76  172  0  0 100  0  0
 0  0      0 7790160   3492 188816    0    0     0     0   88  222  0  1 100  0  0
 0  0      0 7790160   3492 188816    0    0     0     0   83  199  0  0 100  0  0
 0  0      0 7790192   3500 188816    0    0     0    24   87  215  0  0 100  1  0
 0  0      0 7790192   3500 188816    0    0     0     0   76  174  0  0 100  0  0
 0  0      0 7790192   3500 188816    0    0     0     0   77  205  0  0 100  0  0
 0  0      0 7790192   3500 188816    0    0     0     0  125  292  0  0 100  0  0
 0  0      0 7790192   3500 188816    0    0     0   344  215  198  0  0 97  3  0
 0  0      0 7790192   3500 188816    0    0     0     0   64  182  0  0 100  0  0
 1  0      0 7790192   3500 188816    0    0     0     0   82  201  0  1 100  0  0
 0  0      0 7790192   3500 188816    0    0     0     0   65  153  0  0 100  0  0
 0  0      0 7790192   3500 188816    0    0     0     0   58  144  0  0 100  0  0
从上面输出界面里,我们要关注的重点是内存部分的 buff 和 cache,以及 io 部分的 bi 和 bo。
-
buff 和cache 就是我们前面看到的 Buffers 和 Cache,单位是KB。
-
bi 和 bo 则分别表示块设备读取和写入的大小,单位为块/秒。因为Linux中块的大小是1KB,所以这个单位也就等价于KB/s。
正常情况下,空闲系统中你应该看到的是,这几个值在多次结果中一直保持不变。
我们执行 dd 随机写文件:
root@linux:~# dd if=/dev/urandom of=/tmp/file bs=1M count=500500+0 records in500+0 records out524288000 bytes (524 MB, 500 MiB) copied, 2.87644 s, 182 MB/sroot@linux:~## dd if=/dev/urandom of=/tmp/file bs=1M count=500
500+0 records in
500+0 records out
524288000 bytes (524 MB, 500 MiB) copied, 2.87644 s, 182 MB/s
root@linux:~#
然后观察 vmstat 的变化,会发现,在 dd 命令运行时, Cache 在不停地增长,而 Buffer 基本保持不变。
# vmstat 1procs -----------memory---------- ---swap-- -----io---- -system-- ------cpu----- r  b   swpd   free   buff  cache   si   so    bi    bo   in   cs us sy id wa st 0  0      0 752496   2456  77280    0    0     3     7   42    4  0  0 99  0  0 0  0      0 752528   2456  77288    0    0     0     0  123  357  0  1 99  0  0 0  0      0 752528   2456  77288    0    0     0     0  117  371  0  0 100  0  0 0  0      0 752528   2456  77288    0    0     0     0  128  386  0  0 100  0  0 1  0      0 596808   2616 231568    0    0   236 89624  365  515  1 87 12  0  0 1  1      0 418044   2624 410104    0    0     8 166476  390  570  0 100  0  0  0 1  0      0 292168   2624 536124    0    0     0 128536  362 35476  1 73  0 26  0 0  0      0 225996   2632 602336    0    0     8 73728  306 25478  0 37 43 20  0 1  0      0 226124   2632 602336    0    0     0     0  157  352  0  1 99  0  0 0  0      0 226124   2640 602336    0    0     0    56  137  375  0  0 100  0  0 0  0      0 226124   2640 602336    0    0     0     0  134  393  0  1 99  0  0 0  0      0 226124   2640 602336    0    0     0     0  123  358  0  1 99  0  0 0  1      0 226124   2644 602332    0    0     4 37352  148  388  1  0 75 24  0 0  0      0 226156   2796 602352    0    0   160 16384  181  506  0  0 93  7  0 0  0      0 226156   2796 602352    0    0     0     0  129  355  1  0 99  0  0 0  0      0 226156   2796 602352    0    0     0     0  135  396  0  1 99  0  0
procs -----------memory---------- ---swap-- -----io---- -system-- ------cpu-----
 r  b   swpd   free   buff  cache   si   so    bi    bo   in   cs us sy id wa st
 0  0      0 752496   2456  77280    0    0     3     7   42    4  0  0 99  0  0
 0  0      0 752528   2456  77288    0    0     0     0  123  357  0  1 99  0  0
 0  0      0 752528   2456  77288    0    0     0     0  117  371  0  0 100  0  0
 0  0      0 752528   2456  77288    0    0     0     0  128  386  0  0 100  0  0
 1  0      0 596808   2616 231568    0    0   236 89624  365  515  1 87 12  0  0
 1  1      0 418044   2624 410104    0    0     8 166476  390  570  0 100  0  0  0
 1  0      0 292168   2624 536124    0    0     0 128536  362 35476  1 73  0 26  0
 0  0      0 225996   2632 602336    0    0     8 73728  306 25478  0 37 43 20  0
 1  0      0 226124   2632 602336    0    0     0     0  157  352  0  1 99  0  0
 0  0      0 226124   2640 602336    0    0     0    56  137  375  0  0 100  0  0
 0  0      0 226124   2640 602336    0    0     0     0  134  393  0  1 99  0  0
 0  0      0 226124   2640 602336    0    0     0     0  123  358  0  1 99  0  0
 0  1      0 226124   2644 602332    0    0     4 37352  148  388  1  0 75 24  0
 0  0      0 226156   2796 602352    0    0   160 16384  181  506  0  0 93  7  0
 0  0      0 226156   2796 602352    0    0     0     0  129  355  1  0 99  0  0
 0  0      0 226156   2796 602352    0    0     0     0  135  396  0  1 99  0  0
继续上面的操作,清空缓存并执行:
# echo 3 > /proc/sys/vm/drop_caches# dd if=/dev/urandom of=/dev/sdc bs=1M count=2048 echo 3 > /proc/sys/vm/drop_caches
# dd if=/dev/urandom of=/dev/sdc bs=1M count=2048
观察vmstat的输出,会发现读磁盘时(也就是bi大于0时),Buffer 和Cache都在增长,但显然Buffer的增长快很多。这说明读磁盘时,数据缓存到了Buffer 中。也就是说 Buffer 是对磁盘数据的缓存,而 Cache是文件数据的缓存,它们既会用在读请求中,也会用在写请求中。

利用 Linux的内存特性,加速文件访问
我们生成一个临时文件:
# dd if=/dev/sdc of=file bs=1M count=512512+0 records in512+0 records out536870912 bytes (537 MB, 512 MiB) copied, 0.392026 s, 1.4 GB/sof=file bs=1M count=512
512+0 records in
512+0 records out
536870912 bytes (537 MB, 512 MiB) copied, 0.392026 s, 1.4 GB/s
pcstat 是一个可以查看文件缓存命中率的工具,可以在 <https://github.com/tobert/pcstat> 下载编译安装:
git clone https://github.com/tobert/pcstat.gitcd pcstatgo buildsudo cp -a pcstat /usr/local/binpcstat /usr/local/bin/pcstat
cd pcstat
go build
sudo cp -a pcstat /usr/local/bin
pcstat /usr/local/bin/pcstat
我们使用 pcstat 查看文件缓存,并清空换后再次查看确保 cached 为 0:
# pcstat file|----------+----------------+------------+-----------+---------|| Name     | Size           | Pages      | Cached    | Percent ||----------+----------------+------------+-----------+---------|| file     | 536870912      | 131072     | 131072    | 100.000 ||----------+----------------+------------+-----------+---------|root@linux:~# echo 3 > /proc/sys/vm/drop_cachesroot@linux:~# pcstat file|----------+----------------+------------+-----------+---------|| Name     | Size           | Pages      | Cached    | Percent ||----------+----------------+------------+-----------+---------|| file     | 536870912      | 131072     | 0         | 000.000 ||----------+----------------+------------+-----------+---------|
|----------+----------------+------------+-----------+---------|
| Name     | Size           | Pages      | Cached    | Percent |
|----------+----------------+------------+-----------+---------|
| file     | 536870912      | 131072     | 131072    | 100.000 |
|----------+----------------+------------+-----------+---------|
root@linux:~# echo 3 > /proc/sys/vm/drop_caches
root@linux:~# pcstat file
|----------+----------------+------------+-----------+---------|
| Name     | Size           | Pages      | Cached    | Percent |
|----------+----------------+------------+-----------+---------|
| file     | 536870912      | 131072     | 0         | 000.000 |
|----------+----------------+------------+-----------+---------|
执行:
# dd if=/dev/sdc of=file bs=1M count=512512+0 records in512+0 records out536870912 bytes (537 MB, 512 MiB) copied, 5.35013 s, 100 MB/sof=file bs=1M count=512
512+0 records in
512+0 records out
536870912 bytes (537 MB, 512 MiB) copied, 5.35013 s, 100 MB/s
cachestat 和 cachetop 查看系统缓存命中情况,这两个工具来自 bcc 软件包,它们基于 Linux 内核的 eBPF(extended Berkeley Packet Filters)机制,来跟踪内核中管理的缓存,并输出缓存的使用和命中情况。
我们执行cachetop 5 查看 dd 的读写命中都是 25%:

执行下面命令:
# dd if=file of=/dev/null bs=1M512+0 records in512+0 records out536870912 bytes (537 MB, 512 MiB) copied, 5.02737 s, 107 MB/sfile of=/dev/null bs=1M
512+0 records in
512+0 records out
536870912 bytes (537 MB, 512 MiB) copied, 5.02737 s, 107 MB/s
查看缓存发现只命中 50%:

执行下面命令:
# dd if=file of=/dev/null bs=1M512+0 records in512+0 records out536870912 bytes (537 MB, 512 MiB) copied, 0.142228 s, 3.8 GB/sfile of=/dev/null bs=1M
512+0 records in
512+0 records out
536870912 bytes (537 MB, 512 MiB) copied, 0.142228 s, 3.8 GB/s
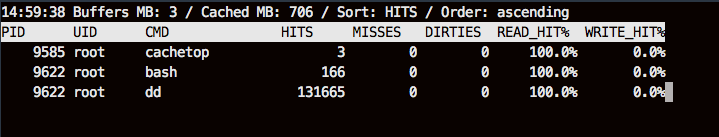
可以发现第二次执行 dd 每秒写速度3.8GB, 第一次是107MB。这就是充分利用了缓存而达到的效果,因此使用dd 进行测试时候需要注意缓存而影响测试效果不准确。
人工智能如何学?
作为码一代,想教码二代却无从下手:
听说少儿编程很火,可它有哪些好处呢?
孩子多大开始学习比较好呢?又该如何学习呢?
最新的编程教育政策又有哪些呢?
下面给大家介绍CSDN新成员:极客宝宝(ID:geek_baby)
戳他了解更多↓↓↓

热 文 推 荐
☞IEEE 回应禁止华为系审稿人;WiFi联盟、蓝牙联盟已恢复华为成员资格;中国计算机学会:暂时中止与IEEE通信学会合作……
☞敲诈团伙将黑手伸向宅男, 你在家看不可描述的视频, 竟被骗走100万美元!
☞敲代码时,程序员戴耳机究竟在听什么?
 你点的每个“在看”,我都认真当成了喜欢

20年前,《新程序员》创刊时,我们的心愿是全面关注程序员成长,中国将拥有新一代世界级的程序员。20年后的今天,我们有了新的使命:助力中国IT技术人成长,成就一亿技术人!
更多推荐


 50
50 0
0- 0


 已为社区贡献12373条内容

所有评论(0)